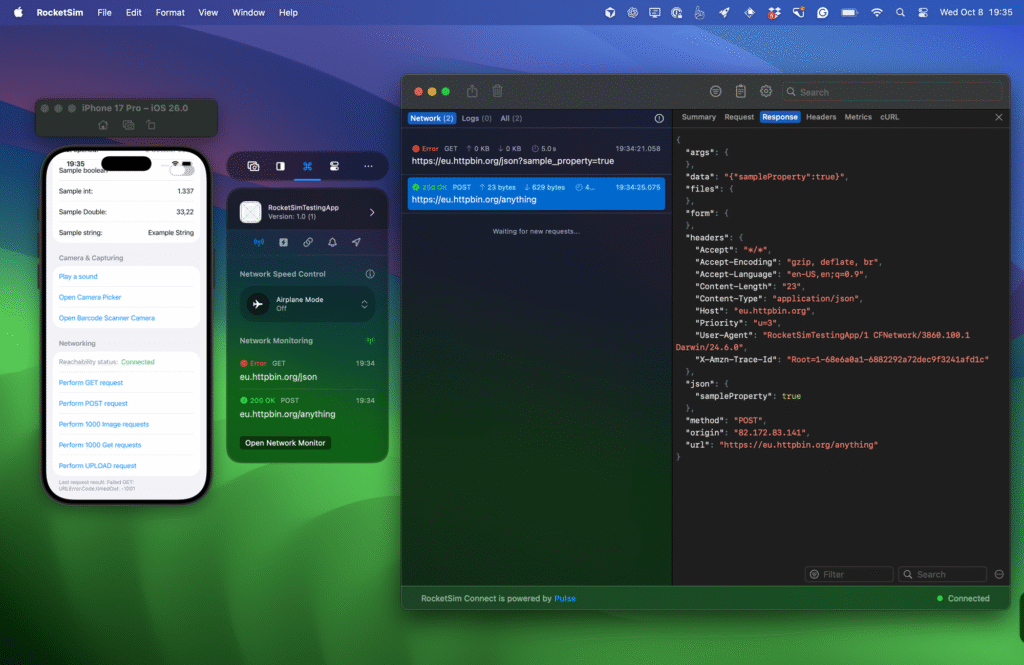
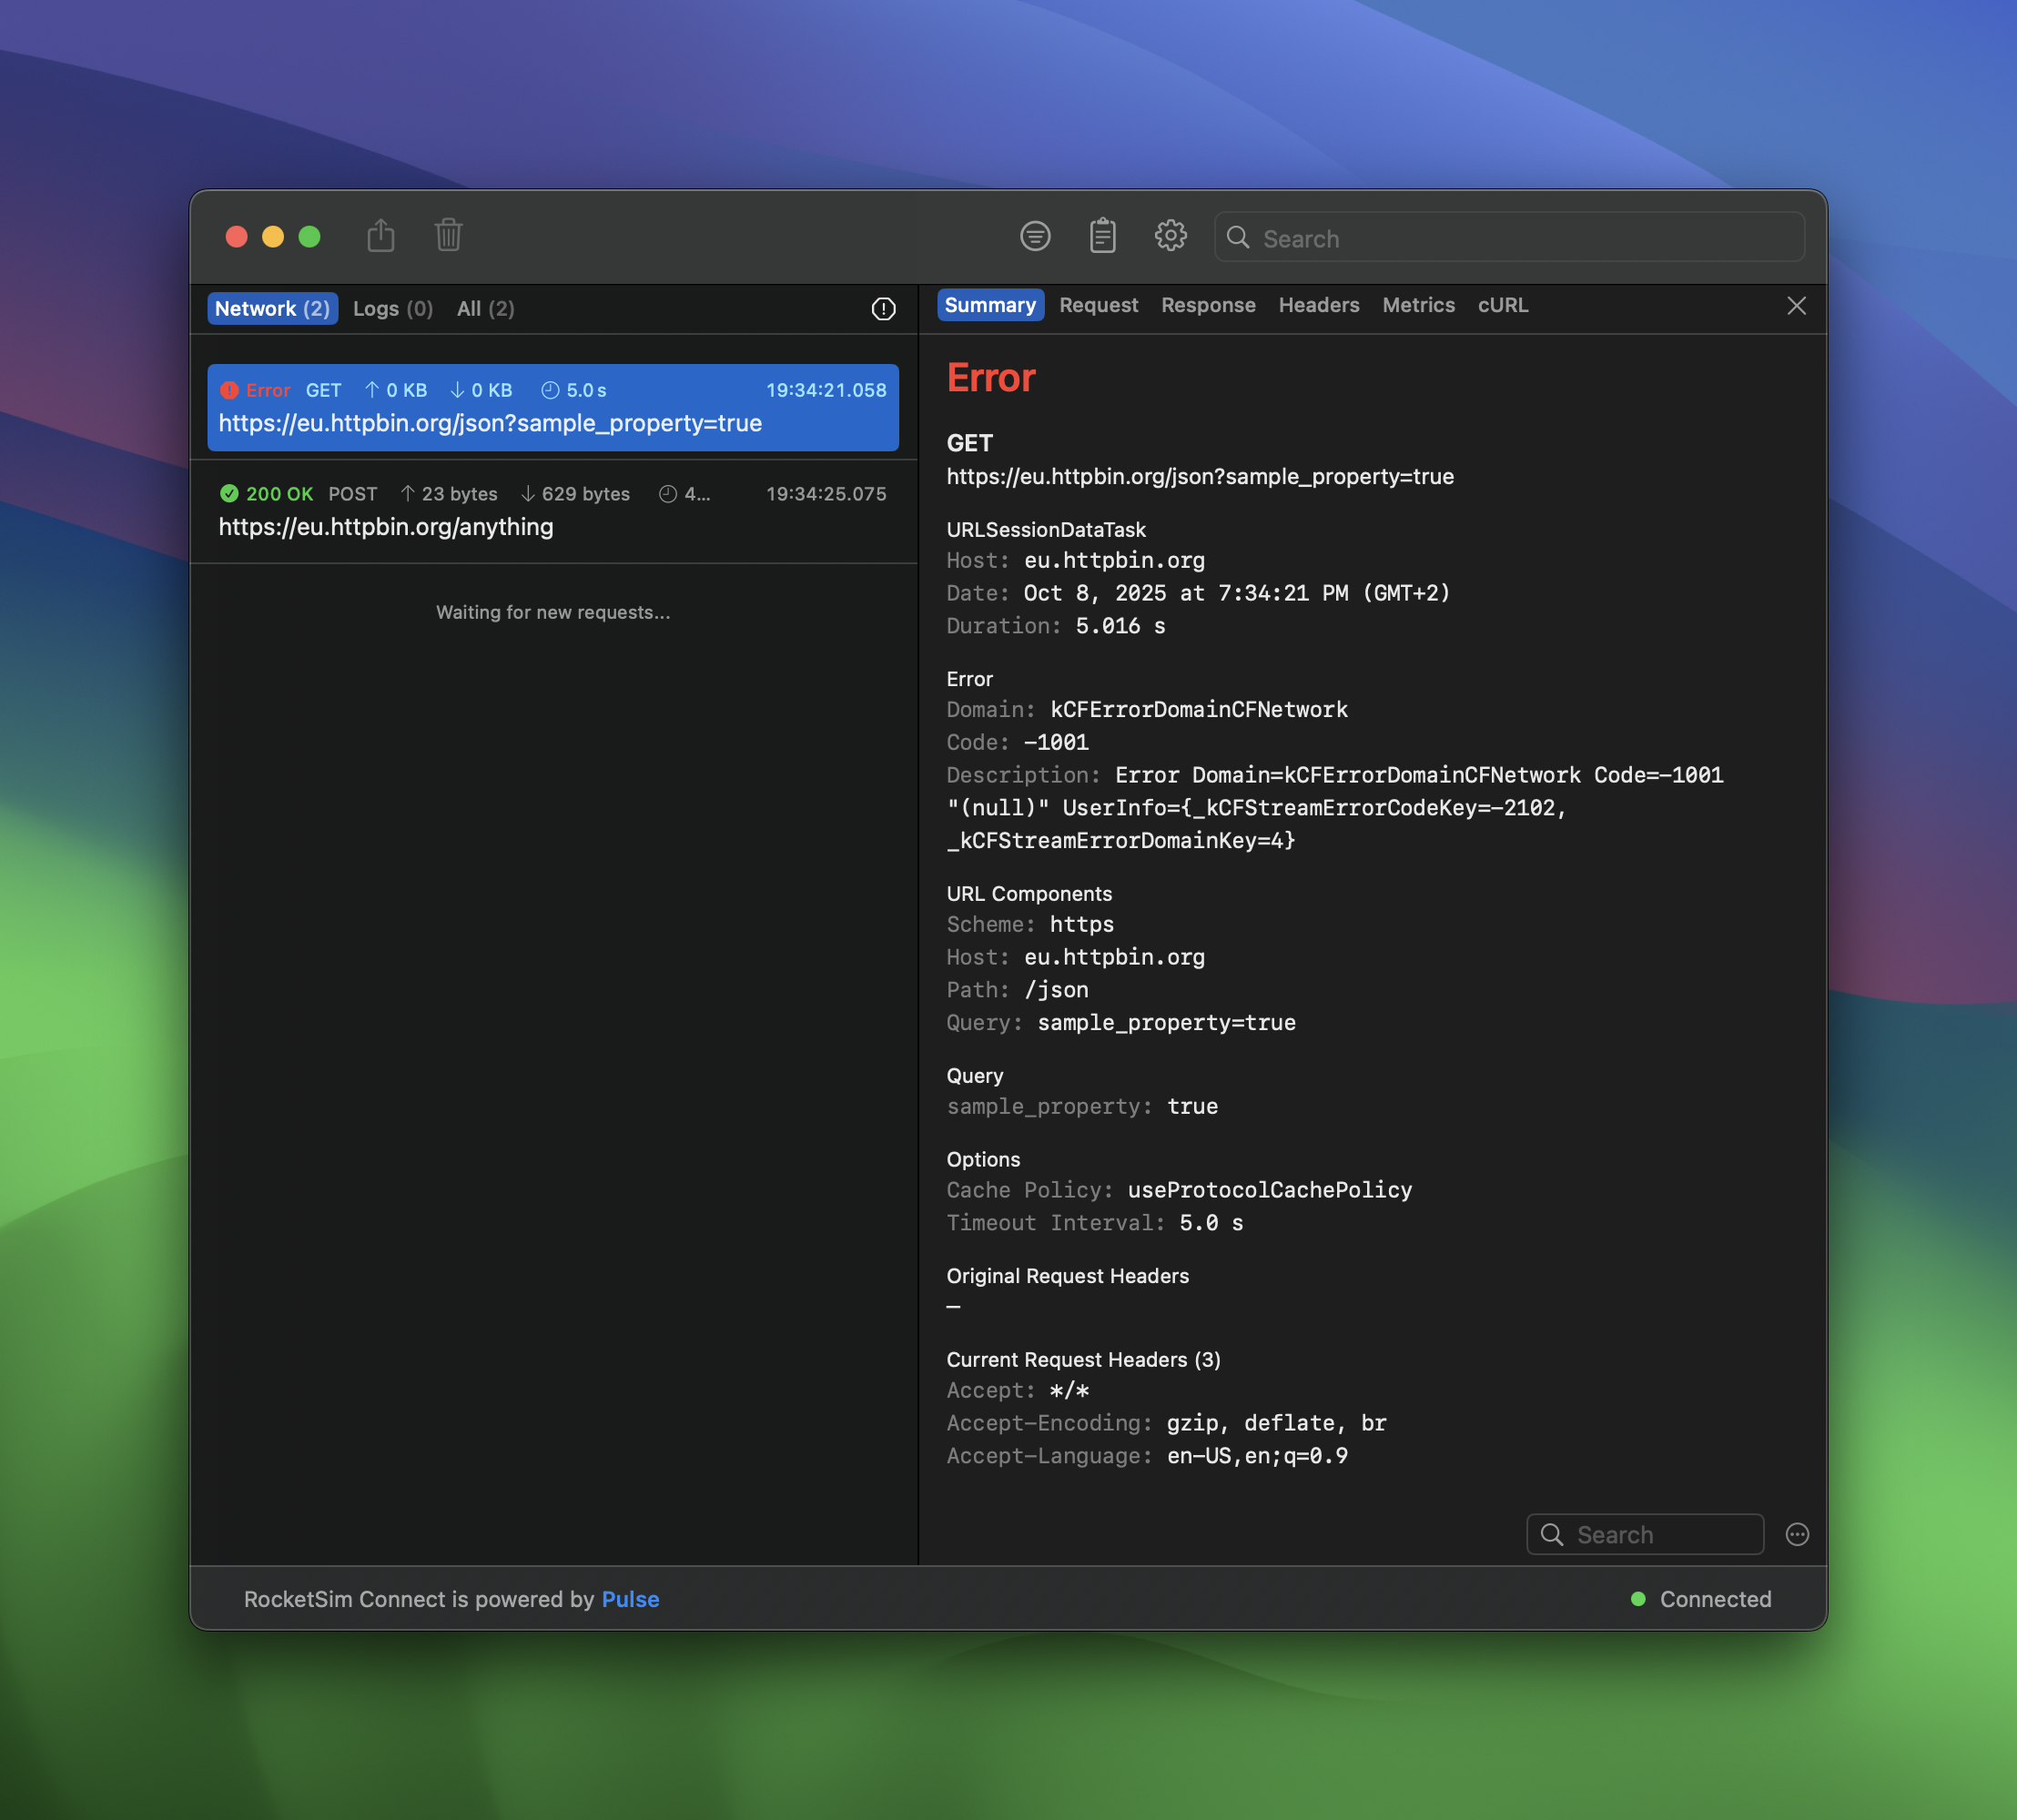
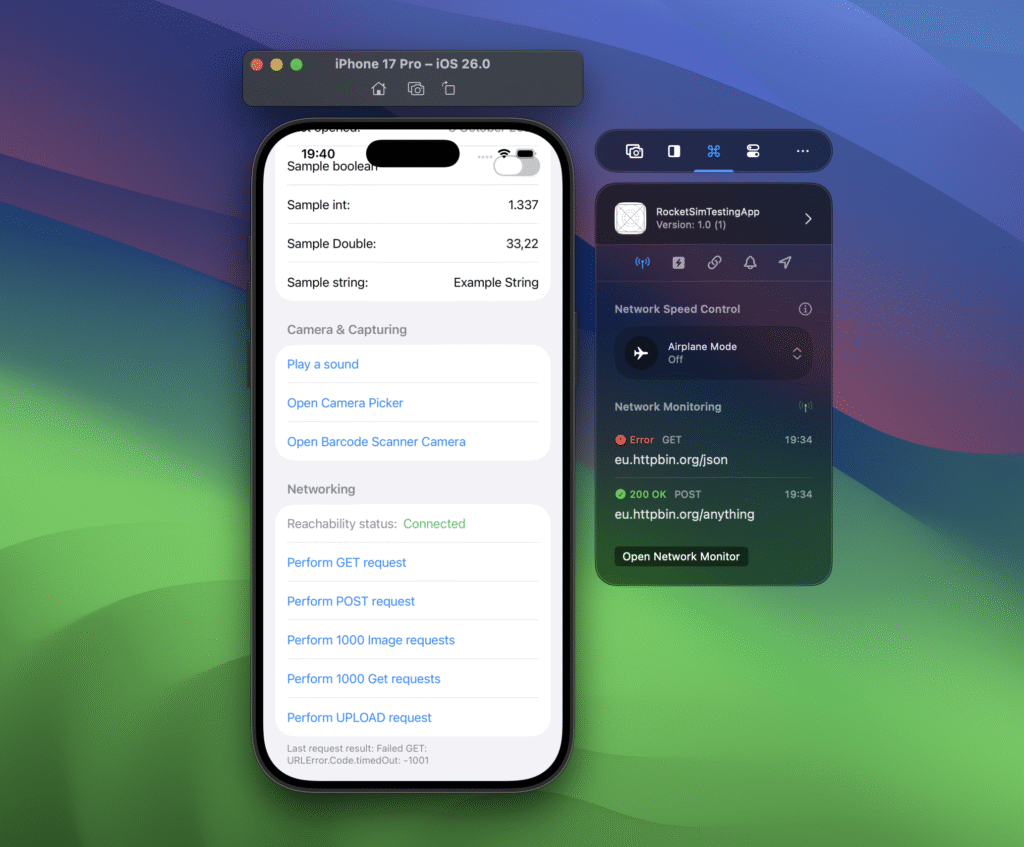
The 14.5.0 release is now officially available in the App Store and introduces two significant new features. With AI prompts generated from the Network Monitor you’ll have a first way to benefit from data collected inside RocketSim. Recording metadata allows you to promote your apps with a higher chance of success.
Exporting Network Requests AI Prompts
We’re preparing for the future of RocketSim, in which we bring your Agent tooling closer to the Simulator. RocketSim collects data such as build insights and network requests, which can be incredibly valuable when AI has access to them. We imagine using AI to improve networking, build performance, app design, and more.
The first step is a feature available today: Network Request Prompts.

We’re starting with 3 prompts you can pick from:
- Redundant calls & caching
Analyze redundant calls and caching opportunities. - Performance & overfetching
Analyze performance, overfetching, timeouts, and payload bloat. Highlight the largest bytes out, slowest durations, and fingerprints with varying bytes out. - Failures & error spikes
Analyze failures and error spikes, focusing on non-2xx; hypothesize causes (auth, validation, rate limits, server errors) and list next debug steps.
This is just the beginning, and we’d love to hear from you on how we can improve these prompts. Maybe you even know additional prompts we can add.
Privacy-first with heavy redaction
The first thing you might wonder is how we share the network requests within the prompt. Your request contains sensitive data, such as authentication tokens and user data. We don’t want to leak them into any AI tool.
Therefore, we focused heavily on redaction, only sharing what matters for the task we’re executing. Here’s an example prompt:
Analyze redundant calls and caching opportunities. Group by fingerprint; provide table columns: count, cache hint, dedupe window, memoization key. Then recommend batching/conditional requests:

Summary: 2026-01-16T13:27:25.378Z – 2026-01-16T13:27:40.109Z | requests: 21 | fingerprints: 14 | errors: 1 | slow(>500ms): 0
2026-01-16T13:27:27.363Z GET www.googleapis.com /youtube/v3/videos?{id,part} 200 72ms in:- out:80 KB ct:application/json; charset=UTF-8 #87ada2
  stats: count:4 min:72ms p50:124ms max:172ms
2026-01-16T13:27:26.741Z GET www.googleapis.com /youtube/v3/channels?{id,part} 304 225ms in:- out:- ct:application/json; charset=UTF-8 #5a0cba
  stats: count:4 min:53ms p50:83ms max:225ms
2026-01-16T13:27:27.008Z GET www.googleapis.com /youtube/v3/commentThreads?{allThreadsRelatedToChannelId,maxResults,order,part,textFormat} 304 318ms in:- out:- ct:application/json; charset=UTF-8 #66c52b
  stats: count:2 min:318ms p50:435ms max:435ms
2026-01-16T13:27:27.363Z GET www.googleapis.com /youtube/v3/playlistItems?{maxResults,pageToken,part,playlistId} 304 224ms in:- out:- ct:application/json; charset=UTF-8 #a85d56
  stats: count:1 min:224ms p50:224ms max:224ms
2026-01-16T13:27:40.109Z GET yt3.ggpht.com /ytc/AIdro_mr4ubik6szRQk0IT4R1Wpxv5L0fy6UtUb9krE7YUwkLqg=s48-c-k-c0x00ffffff-no-rj 200 46ms in:- out:940 bytes ct:image/jpeg #0d021e
  stats: count:1 min:46ms p50:46ms max:46ms
2026-01-16T13:27:25.378Z POST oauth2.googleapis.com /token 200 291ms in:275 bytes out:444 bytes ct:application/json; charset=utf-8 #047182
  stats: count:1 min:291ms p50:291ms max:291ms
2026-01-16T13:27:26.796Z GET www.googleapis.com /youtube/v3/channels?{mine,part} 304 143ms in:- out:- ct:application/json; charset=UTF-8 #a46ca8
  stats: count:1 min:143ms p50:143ms max:143ms
2026-01-16T13:27:40.104Z GET yt3.ggpht.com /e2ogn5CTP8TmDlhVn6M7scf97mstLYBAYEC8uf8t6AXUNTmOQ98P8cQuVLcLLxUIb6d7OJAa=s48-c-k-c0x00ffffff-no-rj 200 419ms in:- out:2 KB ct:image/jpeg #d42cb5
  stats: count:1 min:419ms p50:419ms max:419ms
2026-01-16T13:27:27.779Z GET youtubeanalytics.googleapis.com /v2/reports?{dimensions,endDate,filters,ids,maxResults,metrics,sort,startDate} 200 400ms in:- out:4 KB ct:application/json; charset=UTF-8 #df4d4c
  stats: count:1 min:400ms p50:400ms max:400ms
2026-01-16T13:27:40.107Z GET yt3.ggpht.com /ytc/AIdro_ljEM7oAi8W-J_NFkpQGj5ejMOoMsYhzLp3slvSxVQ=s48-c-k-c0x00ffffff-no-rj 200 95ms in:- out:826 bytes ct:image/jpeg #9bdcf6
  stats: count:1 min:95ms p50:95ms max:95ms
2026-01-16T13:27:40.106Z GET yt3.ggpht.com /ytc/AIdro_kGCfFJCiyz8FnynrAN_I4Fji6c4UK7KorjRzmVrhrYoA=s48-c-k-c0x00ffffff-no-rj 200 244ms in:- out:2 KB ct:image/jpeg #008429
  stats: count:1 min:244ms p50:244ms max:244ms
2026-01-16T13:27:40.108Z GET yt3.ggpht.com /ytc/AIdro_nD-SrZRfwve4qS5Dh8PD8Ep2LL3JuOvaLHdNVhzcGSDk8=s48-c-k-c0x00ffffff-no-rj 200 56ms in:- out:2 KB ct:image/jpeg #6423a2
  stats: count:1 min:56ms p50:56ms max:56ms
2026-01-16T13:27:27.016Z GET www.googleapis.com /youtube/v3/playlistItems?{maxResults,part,playlistId} 304 288ms in:- out:- ct:application/json; charset=UTF-8 #5ce196
  stats: count:1 min:288ms p50:288ms max:288ms
2026-01-16T13:27:40.102Z GET yt3.ggpht.com /ytc/AIdro_mWmGoeDeFCP9ZIxycZxvst6RG4-UFSNC8TycQ41y2FVa0j=s48-c-k-c0x00ffffff-no-rj 200 256ms in:- out:2 KB ct:image/jpeg #920d56
stats: count:1 min:256ms p50:256ms max:256msNothing special in this prompt, or at least, no sensitive data. We optimized the requests for AI to analyze. For example, it contains a fingerprint (e.g. #920d56), which makes it easy to find duplicates.
Reducing token usage
If we shared raw request data, your tokens and context would be easily filled in. We reduced output as much as possible, while retaining enough information for the prompt to be useful.
We’d love for you to try this out and let us know on GitHub in case you find any improvements.
Showing metadata on top of screenshots and recordings
Another wish I’ve had for a while is to showcase the app’s title and website whenever I share a recording of my app. There’s now a new toggle in the side window that allows you to show metadata on top of captures:

Once enabled, RocketSim will try to fill in the metadata based on your most recent build. Additionally, you can provide the metadata to use in the settings for your app’s bundle identifier:

Eventually, once configured, your captures can look like this:
Build monitoring performance improvements
Less visible, but just as important, are the performance improvements we made. RocketSim monitors your builds to provide build insights:

Analyzing your builds used to be quite CPU-heavy, even though we only needed to know whether your build was incremental or clean. In some cases, if you opened RocketSim after a while, RocketSim could run with 100% CPU to analyze all the builds it didn’t read before.
It also turned out that Xcode 26.2 changed the build log format, making it harder for us to determine the build type. Therefore, we revisited this logic completely, resulting in a more reliable analysis pipeline that will never reach 100% CPU. It’s lightning fast!
Get started today
Get the update from the App Store and get started with these new changes today.
Full Changelog
New:
- Side window shows a clear icon now for the Network Monitoring quick view.
- You can now configure metadata to appear above captures. See the new metadata toggle in the side window.
- The Network Monitor console allows you to export network requests for AI evaluation, including predefined prompts.
- Network requests in the Network Monitor console can now be navigated using arrow keys (up/down) when a cell is selected.
Improved:
- Monitoring system settings like dark mode is now more efficient.
Fixed:
- Simulator Camera dropdown no longer appears empty
- Preview popover now scales to the available screen with padding so captures always fit.
- Builds created by Xcode 26.2 are now properly monitored.
- Optimized the performance of monitoring new builds and prevented duplicate parsing of build logs.
- Settings sidebar can no longer collapse.